Note: This is part of a Research Update series that highlights projects funded by the California Department of Food and Agriculture’s (CDFA) Fertilizer Research and Education Program (FREP) annual grant program.
Project Title: Nitrogen Content of the Harvested Portion of Specialty Crops to Estimate Crop Nitrogen Removal and Improve Nitrogen Management in Crops
Project Leaders: Richard Smith, University of California Cooperative Extension (UCCE) Vegetable Crops Farm Advisor, Monterey/San Benito/Santa Cruz counties
Michael Cahn, UCCE Irrigation and Water Resources Farm Advisor, Monterey/San Benito/Santa Cruz counties
Aparna Gazula, UCCE Farm Advisor, Santa Clara/San Benito/Santa Cruz counties
Andre Biscaro, UCCE Farm Advisor, Ventura County
Project Status: Completed
Project Locations: Commercial fields in Monterey, San Benito, Santa Clara, and Ventura counties
Overview
Through the state’s Irrigated Lands Regulatory Program (ILRP), the Central Coast Regional Water Quality Control Board (CCRWQCB) requires farmers to calculate the nitrogen (N) left in the field after harvest to estimate N that is at risk for leaching into groundwater. ILRP recordkeeping requires a calculation of both the N applied through different types of fertilizers, crop amendments, and irrigation water, as well as N removed through crop harvest, incorporation into woody plant tissue, and other methods such as water treatment. N removal coefficients are an important tool for this calculation because they provide growers and Certified Crop Advisors with a simple, affordable method for estimating the N removed in the harvested portion of the crop. However, N removal coefficients can vary due to soil properties and management practices. Thus, it is important that these coefficients accurately reflect the range of growing conditions and production practices used by growers on the Central Coast.
The researchers originally proposed to evaluate the N removed in the harvested material of 35 crops, but after receiving input from growers and the CCRWQCB, increased the number to 75 commodities and commodity products, representing 95% of the acreage covered in the region. Crop N removal coefficients were calculated for berries, vegetables, leafy greens, herbs, flowers, and specialty Asian crops.
Approach
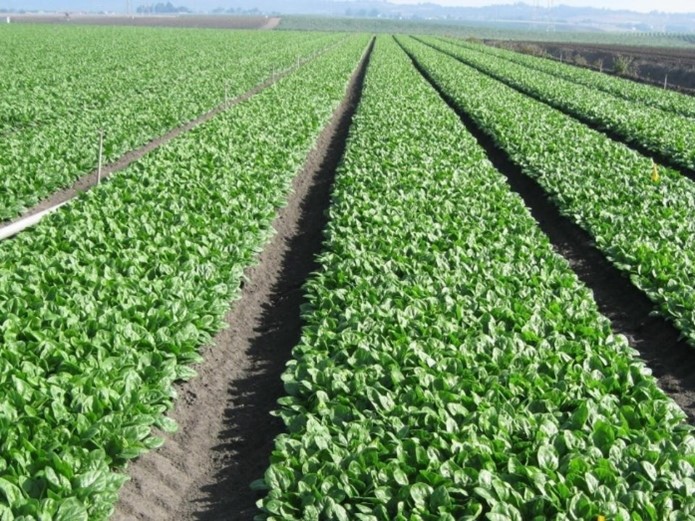
Between 2020 and 2024, cooperating growers were contacted and arrangements were made for sampling commercial production fields for the principle cool season vegetables grown on the Central Coast, as well as berries and other specialty crops important to small growers. Due to the large variety of flowers grown in the region, two flowers were selected as representative types: gerberas for single flower stems with no foliage and snap dragons for single flower stems with foliage.
Fields were chosen to represent a broad range of geographic locations, soil types, and production and irrigation practices. Samples were collected from four to six locations across the field. They were immediately weighed in the field to get the fresh weight biomass of the commodity. Samples were then dried at 60˚C for 48-72 hours and reweighed to obtain dry biomass weight. Dried samples were analyzed for total N content. Percent solids of the commodity were calculated from the fresh and dry weight evaluations.
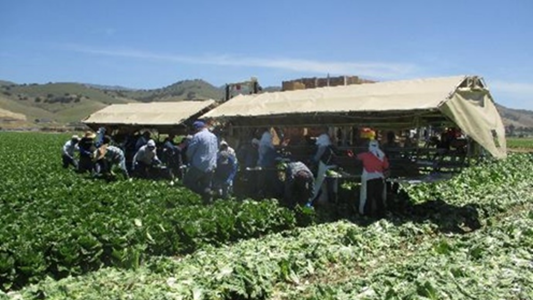
Photo: Crew harvesting a lettuce field. Samples were taken directly from in-field harvest crews for drying to determine N removal coefficients for each commodity sampled in this project.
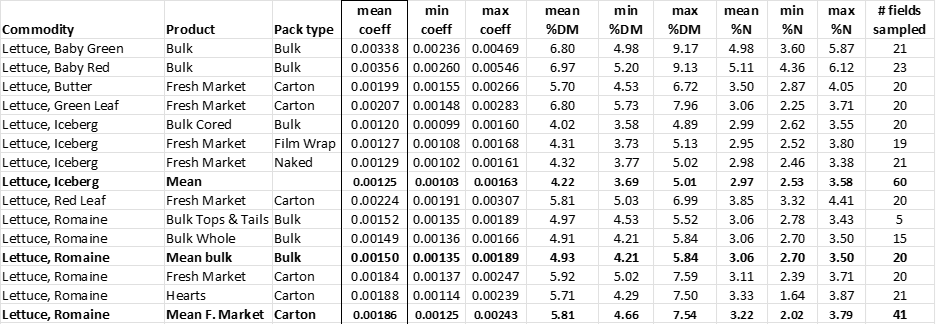
N removal coefficients were developed by multiplying the percent dry matter (DM) content by the percent N in the sample plant tissue. Below is an example for calculating the N removed from fresh market romaine lettuce in cartons, using the mean values found in Table 1:
DM of crop = 5.92% (0.0592)
Nitrogen content of crop = 3.11% (0.0311)
Crop N removal coefficient = 0.0592 x 0.0311 = 0.00184
Using yield data, the total N removed during harvest can be calculated. If the average net weight of the romaine crop per carton was 1,000 cartons/acre with an average net weight per carton of 40 lbs., then a total of 40,000 lbs./acre of lettuce was harvested.
Total N removed from crop = 74 lbs./acre (0.00184 x 40,000 = 73.6)
Project Results
The N removal coefficients calculated in this project range from 0.00078 for blueberries to 0.00727 for pea tips. This is more than a nine-fold difference between the lowest and highest values.
Table 1: Excerpt from N removal coefficient table developed for 75 crops showing coefficients for 15 lettuce varieties with different pack types. Factors used to develop the coefficients include mean and range of crop coefficients (coeff), percent dry matter (%DM) and percent nitrogen (%N).
Project Findings
N removal coefficient values increase with greater N and DM content:
Higher concentrations of N and DM content, or plant solids, in the harvested plant tissue resulted in greater removal coefficients. The variability between samples of the same crop type was influenced by factors such as irrigation, soil type, fertilization practices, and crop varieties that favor higher percent N and DM. For example, the researchers found that harvested crops from fields with higher N fertilization tended to increase N concentration, while drier harvest conditions tended to increase DM percentage. In both cases, higher N removal coefficient values were observed.
N removal coefficients tend to segregate by crop type:
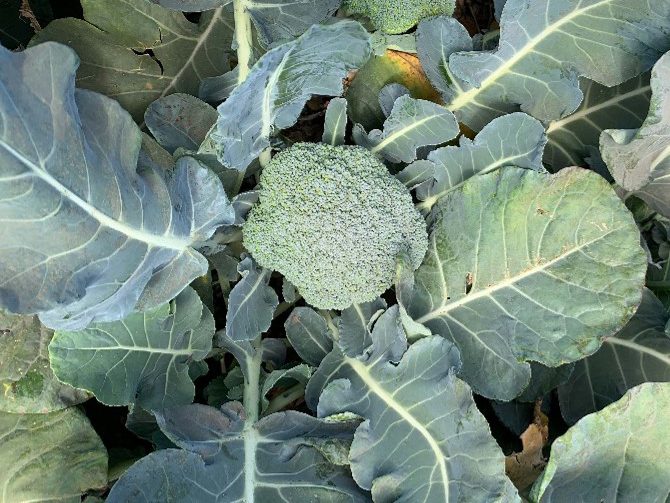
Coefficients tended to fall into recognizable ranges depending on the type of commodity. As a group, leafy and flowering vegetables with high N content such as arugula, broccoli, cilantro, kale, and spinach tended to have higher N removal coefficients, ranging from 0.00400 to 0.00700, while bulb or heading vegetables with low to moderate N content like cabbage, fennel, leeks, mature lettuce, and onions tended to have lower coefficients in the 0.00100 to 0.00250 range. This difference is explained by the greater quantities of chlorophyl in the leafy and flowering vegetables, which are rich in N.
Mean N removal coefficients are intended to represent typical conditions:
The N removal coefficients developed during this project provide growers with a simple method for determining the amount of N removed from their fields. The mean values are taken from an average of 15-20 fields and are intended to represent standard growing conditions with common commercial varieties that can be widely applied. However, the data also shows considerable variability between the percent N content and solids for individual crop types, which is reflected in the minimum and maximum coefficients. Growers may determine that the maximum coefficient is more appropriate due to particular growing conditions that favor a higher-than-average percent N or solids content, but they will need to justify this when reporting to the CCRWQCB.
Project Impact
The N removal coefficients developed in this project were shared with the CCRWQCB and Central Coast Water Quality Preservation Inc. (Preservation Inc.), which is a third-party group assisting growers to meet water quality regulations in the region. The values were incorporated into the dropdown menu used for filling out the Irrigation and Nutrient Management Plan (INMP) Summary Reports by Preservation Inc. and shared with growers and consultants. As a result, the new N removal coefficients were first used in the March 2024 INMP reporting to the CCRWQCB.
The results from this project were also presented during annual grower meetings and with the CA Leafy Greens Research Board. In addition, principal investigator Richard Smith participated in a panel discussion at this year’s FREP conference with a staff member from Preservation Inc. and researchers from two other FREP-funded projects who are calculating N removal coefficients in the Central and Imperial/Coachella valleys. The panel discussed their respective project findings, regional differences, and the relationship between N removal coefficients and efficient N management.
You can find the current list of N removal coefficients through the CCRWQCB March 2024 updated table and the final report for this project.
To learn more about this project and other current and completed FREP projects please visit the FREP Research & Project Database.